1981 UK local government election
The 1981 Merseyside County Council election took place on 7 May to elect members of Merseyside County Council in England.[1] This was on the same day as other local elections.
Merseyside County Council was abolished in 1986.
Election results
Overall election result
Overall result compared with 1977.
| Merseyside County Council election, 1981 |
| Party | Candidates | Votes |
| Stood | Elected | Net | % of total | % | № | Net % |
| | Labour | 97 | 57 |  31 31 | 57.6 | 45.8 | 190,757 | 18.4 |
| | Conservative | 99 | 27 |  40 40 | 27.3 | 29.3 | 122,050 | 25.8 |
| | Liberal | 88 | 15 | 9 | 15.2 | 24.1 | 100,218 | 7.8 |
| | Residents | 2 | 0 |  0 0 | 0.0 | 0.4 | 1,728 | N/A |
| | Ecology | 2 | 0 | 0 | 0.0 | 0.1 | 585 | New |
| | Communist | 7 | 0 | 0 | 0.0 | 0.1 | 545 | 0.5 |
| | British Democratic | 2 | 0 | 0 | 0.0 | 0.1 | 264 | New |
| | Independent | 1 | 0 | 0 | 0.0 | 0.0 | 184 | 0.1 |
| | Independent Liberal | 1 | 0 | 0 | 0.0 | 0.0 | 61 | 0.0 |
[1]
Results by borough
Knowsley
| Merseyside County Council election, 1981 (Knowsley) |
| Party | Candidates | Votes |
| Stood | Elected | Net | % of total | % | № | Net % |
| | Labour | 11 | 10 | 3 | 90.9 | 68.5 | 27,110 | 23.7 |
| | Conservative | 11 | 1 | 3 | 9.1 | 18.6 | 7,350 | 29.9 |
| | Liberal | 9 | 0 | 0 | 0.0 | 13.0 | 5,136 | 9.6 |
[1]
Turnout: 31.9% (2.1%)
Liverpool
| Merseyside County Council election, 1981 (Liverpool) |
| Party | Candidates | Votes |
| Stood | Elected | Net | % of total | % | № | Net % |
| | Labour | 36 | 21 | 11 | 58.3 | 46.9 | 67,144 | 18.7 |
| | Liberal | 36 | 8 | 5 | 22.2 | 30.9 | 44,273 | 7.4 |
| | Conservative | 36 | 7 | 16 | 19.4 | 21.7 | 31,057 | 25.3 |
| | Communist | 7 | 0 | 0 | 0.0 | 0.4 | 545 | 0.5 |
| | Independent Liberal | 1 | 0 | 0 | 0.0 | 0.0 | 61 | 0.1 |
[1]
Turnout: 37.1% (3.2%)
Sefton
| Merseyside County Council election, 1981 (Sefton) |
| Party | Candidates | Votes |
| Stood | Elected | Net | % of total | % | № | Net % |
| | Conservative | 19 | 9 | 6 | 47.4 | 38.1 | 31,108 | 25.6 |
| | Labour | 17 | 6 | 3 | 31.6 | 34.4 | 28,070 | 14.2 |
| | Liberal | 15 | 4 | 3 | 21.1 | 24.8 | 20,190 | 10.1 |
| | Residents | 2 | 0 | 0 | 0.0 | 2.1 | 1,728 | N/A |
| | Ecology | 1 | 0 | 0 | 0.0 | 0.6 | 474 | New |
[1]
Turnout: 36.6% (2.6)
St Helens
| Merseyside County Council election, 1981 (St Helens) |
| Party | Candidates | Votes |
| Stood | Elected | Net | % of total | % | № | Net % |
| | Labour | 11 | 9 | 6 | 81.8 | 56.8 | 28,191 | 20.4 |
| | Conservative | 11 | 2 | 6 | 18.2 | 26.6 | 13,172 | 31.4 |
| | Liberal | 8 | 0 | 0 | 0.0 | 16.2 | 8,061 | 10.6 |
| | Independent | 1 | 0 | 0 | 0.0 | 0.4 | 184 | N/A |
[1]
Turnout: 35.7% (1.6%)
Wirral
| Merseyside County Council election, 1981 (Wirral) |
| Party | Candidates | Votes |
| Stood | Elected | Net | % of total | % | № | Net % |
| | Labour | 22 | 11 | 8 | 50.0 | 39.2 | 40,242 | 18.1 |
| | Conservative | 22 | 8 | 9 | 36.4 | 38.4 | 39,363 | 22.0 |
| | Liberal | 20 | 3 | 1 | 13.6 | 22.0 | 22,558 | 4.0 |
| | British Democratic | 2 | 0 | 0 | 0.0 | 0.3 | 264 | New |
| | Ecology | 1 | 0 | 0 | 0.0 | 0.1 | 111 | New |
[1]
Turnout: 39.9% (1.9%)
Ward results
Results compared directly with the last local election in 1977.
Knowsley
Huyton With Roby No. 1 (Huyton Farm, Princess & Woolfall)
Huyton With Roby No. 1 (Huyton Farm, Princess & Woolfall) | Party | Candidate | Votes | % | ±% |
| | Labour | P. Longfall * | 2,116 | 91% | 31% |
| | Conservative | A. Simpson | 210 | 9% | 31% |
| Majority | 1,906 | | |
| Registered electors | 9,165 | | |
| Turnout | 2,346 | 25.6 | 5.1 |
| Rejected ballots | | | |
| | Labour hold | Swing | 31 | |
[3] [4]
Huyton With Roby No. 2 (Longview and Rupert Farm)
Huyton With Roby No. 2 (Longview and Rupert Farm) | Party | Candidate | Votes | % | ±% |
| | Labour | J. Maguire | 1,891 | 65% | |
| | Conservative | J. E. Easthope | 560 | 19% | |
| | Liberal | D. Cottier | 439 | 15% | |
| Majority | 1,331 | | |
| Registered electors | 9,072 | | |
| Turnout | 2,894 | 32 | |
| Rejected ballots | | | |
| | Labour hold | Swing | | |
[3] [4]
Huyton With Roby No. 3 (St. Agnes, St. Bartholomews & Swanside)
Huyton With Roby No. 3 (St. Agnes, St. Bartholomews & Swanside) | Party | Candidate | Votes | % | ±% |
| | Conservative | W. J. Simpson * | 1,982 | 43% | |
| | Labour | E. O'Hara | 1,816 | 39% | |
| | Liberal | L. Cottier | 805 | 17% | |
| Majority | 166 | | |
| Registered electors | 13,599 | | |
| Turnout | 4,610 | 34% | |
| Rejected ballots | 7 | | |
| | Conservative hold | Swing | | |
[3] [4]
Huyton With Roby No. 4 (St. Gabriels & St. Michaels)
Huyton With Roby No. 4 (St. Gabriels & St. Michaels) | Party | Candidate | Votes | % | ±% |
| | Labour | S. S. Powell * | 2,150 | 67% | |
| | Liberal | J. Melia | 518 | 16% | |
| | Conservative | P. Forrester | 517 | 16% | |
| Majority | 1,632 | | |
| Registered electors | 11,211 | | |
| Turnout | 3,195 | 28% | |
| Rejected ballots | 10 | | |
| | Labour hold | Swing | | |
[3] [4]
Kirkby No. 1 (Central Kirkby and Minstead)
Kirkby No. 1 (Central Kirkby and Minstead) | Party | Candidate | Votes | % | ±% |
| | Labour | J. King * | 2,269 | 79 | 22.9 |
| | Liberal | S. Welsh | 495 | 17 | 3.5 |
| | Conservative | K. Johnson | 100 | 3 | 21.3 |
| Majority | 1,774 | 31.8 | 6.4 |
| Registered electors | 9,231 | | |
| Turnout | 2,864 | 31 | |
| | Labour hold | Swing | | |
[3] [4]
Kirkby No. 2 (Cherryfield and Whitfield)
Kirkby No. 2 (Cherryfield and Whitfield) | Party | Candidate | Votes | % | ±% |
| | Labour | J. Gallagher * | 2,577 | 72% | 26.8 |
| | Liberal | G. Sealey | 741 | 21% | 4.7 |
| | Conservative | J. Carraher | 246 | 7% | 27.8 |
| Majority | 325 | 10.4 | 4.2 |
| Registered electors | 11,167 | | |
| Turnout | 3,573 | 32% | 3.9 |
| | Labour hold | Swing | 4.7 | |
[3] [4]
Kirkby No. 3 (Northwood-Park-Tower Hill-Simonswood)
Kirkby No. 3 (Northwood-Park-Tower Hill-Simonswood) | Party | Candidate | Votes | % | ±% |
| | Labour | G. Bundred | 1,983 | 52.5 | 20.1 |
| | Conservative | C. Baily | 1,187 | 31.4 | 12.4 |
| | Liberal | J. Smith | 413 | 10.9 | New |
| | Communist | T. Bradburn | 194 | 5.1 | 3.4 |
| Majority | 796 | 21.1 | 32.5 |
| Registered electors | 15,378 | | |
| Turnout | 3,777 | 24.6 | 3.9 |
| | Labour hold | Swing | 16.3 | |
[3] [4]
Prescot
Prescot | Party | Candidate | Votes | % | ±% |
| | Conservative | W. Hughes | 1,888 | 57.7 | 18.9 |
| | Labour | W. Howarth | 1,386 | 42.3 | 18.9 |
| Majority | 502 | 15.4 | N/A |
| Registered electors | 8,654 | | |
| Turnout | | 37.9 | 4.8 |
| | Conservative gain from Labour | Swing | 18.9 | |
[3] [4]
Whiston No. 1 (Croton-Tarbock-Whiston)
Whiston No. 1 (Croton-Tarbock-Whiston) | Party | Candidate | Votes | % | ±% |
| | Labour | R. Foulkes | 1,444 | 40.1 | 25.5 |
| | Conservative | S. Pyne | 1,390 | 38.6 | 4.2 |
| | Ind. Conservative | B. Jeffrey | 765 | 21.3 | New |
| Majority | 54 | 1.5 | 29.7 |
| Registered electors | 11,132 | | |
| Turnout | | 32.6 | 2.2 |
| | Labour hold | Swing | 14.9 | |
[3] [4]
Whiston No. 3 (Halewood)
Whiston No. 3 (Halewood) | Party | Candidate | Votes | % | ±% |
| | Conservative | J. Sinclair | 2,488 | 54.3 | 26.7 |
| | Labour | J. Bohanna | 2,094 | 45.7 | 26.7 |
| Majority | 394 | 8.6 | 36.2 |
| Registered electors | 14,426 | | |
| Turnout | | 31.8 | 2.5 |
| | Conservative gain from Labour | Swing | 26.7 | |
[3] [4]
Whiston No. 4 (Knowsley)
Whiston No. 4 (Knowsley) | Party | Candidate | Votes | % | ±% |
| | Labour | W. Alldritt | 1,618 | 51.3 | 19.5 |
| | Conservative | T. Maudsley | 1,533 | 48.7 | 29.4 |
| Majority | 85 | 2.6 | 48.9 |
| Registered electors | 11,914 | | |
| Turnout | | 26.5 | 1.2 |
| | Labour hold | Swing | 24.5 | |
[3] [4]
Liverpool
Liverpool No.1 (Abercromby & St. James)
Liverpool No.1 (Abercromby & St. James) | Party | Candidate | Votes | % | ±% |
| | Labour | O. Doyle | 2,049 | 54% | 3.4 |
| | Liberal | Chris Davies | 1,437 | 38% | 32.1 |
| | Communist | R.O'Hara | 158 | 4% | |
| | Conservative | P.M.Cawson | 148 | 4% | 6 |
| Majority | 612 | 16.8 | 17.8 |
| Registered electors | 11,504 | | |
| Turnout | 3,814 | 33% | 14 |
| | Labour hold | Swing | 3.4 | |
[3] [4]
Liverpool No.2 (Aigburth)
Liverpool No.2 Aigburth | Party | Candidate | Votes | % | ±% |
| | Conservative | S. T. Moss * | 2,968 | 49% | 24 |
| | Liberal | G. P. Scott | 1,826 | 30% | 14.9 |
| | Labour | B. Smart | 1,201 | 20% | 9.6 |
| Majority | 1,142 | 19 | 38.8 |
| Registered electors | 14,746 | | |
| Turnout | 6,002 | 41% | 6.7 |
| | Conservative hold | Swing | 24 | |
[3] [4]
Liverpool No.3 (Allerton)
Liverpool No.3 (Allerton) | Party | Candidate | Votes | % | ±% |
| | Conservative | W. S. D. Weaver * | 2,189 | 49% | 24 |
| | Labour | M. O'Neill | 1,180 | 27% | 14.2 |
| | Liberal | N. G. Chinn | 1,053 | 24% | 9.9 |
| Majority | 1,009 | 22.8 | 9 |
| Registered electors | 10,698 | | |
| Turnout | 4,429 | 41.4% | 1.8 |
| | Conservative hold | Swing | 24 | |
[4]
Liverpool No.4 (Anfield)
Liverpool No.4 (Anfield) | Party | Candidate | Votes | % | ±% |
| | Liberal | Carole M. Cartmell | 2,225 | 44% | 25.1 |
| | Labour | J. E. Roberts | 1,848 | 36% | 4.2 |
| | Conservative | T. P. Pink | 1,025 | 20% | 29.3 |
| Majority | 377 | 7.4 | 10.1 |
| Registered electors | 12,478 | | |
| Turnout | 5,104 | 40.9% | 3.8 |
| | Liberal gain from Conservative | Swing | 29.3 | |
[3] [4]
Liverpool No.5 (Arundel)
Liverpool No.5 (Arundel) | Party | Candidate | Votes | % | ±% |
| | Liberal | Roger Johnston | 1,745 | 39.5% | 6.3 |
| | Labour | R. J. Quick | 1,713 | 38.7% | 28.4 |
| | Conservative | H. A. Quayle | 857 | 19.4% | 23.3 |
| | Communist | J. C. Blevin | 85 | 1.9% | 2.0 |
| Majority | 33 | | |
| Registered electors | 12,115 | | |
| Turnout | 4,422 | 36.5% | 3.2 |
| | Liberal gain from Conservative | Swing | 29.6 | |
[3] [4]
Liverpool No.6 (Breckfield & St. Domingo)
Liverpool No.6 (Breckfield & St. Domingo) | Party | Candidate | Votes | % | ±% |
| | Labour | J. Brazier | 1,884 | 48.6% | 17.8 |
| | Liberal | F. McNevin | 1,708 | 44.0% | 15.4 |
| | Conservative | Pauline Dougherty | 276 | 7.1% | 33.5 |
| Majority | 176 | | |
| Registered electors | 11,179 | | |
| Turnout | 3,879 | 34.7% | 2.3 |
| | Labour gain from Conservative | Swing | 51.3 | |
[3] [4]
Liverpool No.7 (Broadgreen)
Liverpool No.7 (Broadgreen) | Party | Candidate | Votes | % | ±% |
| | Labour | B. Wright | 1,660 | 37.3 | 8.0 |
| | Liberal | G. L. Holmes | 1,651 | 37.1 | 1.8 |
| | Conservative | R. D. Oughton | 1,134 | 25.5% | 9.8 |
| Majority | 9 | 0.02 | 6.38 |
| Registered electors | 11,833 | | |
| Turnout | 4,449 | 37.6% | 1.9 |
| | Labour hold | Swing | 8.0 | |
[3] [4]
Liverpool No.8 (Central & Everton)
Liverpool No.8 (Central & Everton) | Party | Candidate | Votes | % | ±% |
| | Labour | K. C. Coombes | 2,565 | 86.1% | 24.5 |
| | Liberal | W. Barrow | 231 | 7.8% | 2.9 |
| | Conservative | E. J. Crighton | 172 | 5.8% | 6.4 |
| Majority | 2,334 | 78.35% | 44.65% |
| Registered electors | 10,638 | | |
| Turnout | 2,979 | 28% | 6.8 |
| | Labour hold | Swing | 24.5 | |
[3] [4]
Liverpool No.9 (Childwall)
Liverpool No.9 (Childwall) - 2 seats | Party | Candidate | Votes | % | ±% |
| | Conservative | C. Henry De Boer * | 3,114 | 43.8% | 44.9 |
| | Conservative | Mary V .Wood * | 3,060 | 43.0% | 45.7 |
| | Labour | P. Astbury | 2,072 | 29.1% | 15.6 |
| | Labour | A. Mulhearn | 2,040 | 28.7% | 15.2 |
| | Liberal | W. A. Barton | 1,928 | 27.1% | 10.4 |
| | Liberal | E. M. Brash | 1,887 | 26.5 | 11.0 |
| Majority | 1,042 | | |
| Registered electors | 19,620 | | |
| Turnout | 7,114 | 36.3 | 3.0 |
| | Labour gain from Conservative party (UK) | Swing | | |
| | Labour gain from Conservative party (UK) | Swing | | |
[3] [4]
Liverpool No.10 (Church)
Liverpool No.10 (Church) | Party | Candidate | Votes | % | ±% |
| | Liberal | Leonard Tyrer | 3,163 | 46.6% | 5.5 |
| | Conservative | H.C.Bolton-Jones | 2,284 | 33.6% | 7.6 |
| | Labour | Maria Gee | 1,326 | 19.5% | 11.8 |
| Majority | 879 | 12.95 | 2.85 |
| Registered electors | 14,728 | | |
| Turnout | 6,790 | 46.1% | 1 |
| | Liberal gain from Labour | Swing | 13.1 | |
[3] [4]
Liverpool No.11 (Clubmoor)
Liverpool No.11 (Clubmoor) | Party | Candidate | Votes | % | ±% |
| | Labour | H. Rimmer | 2,161 | 49.4% | 23.0 |
| | Liberal | Audrey Humphries | 1,699 | 38.8% | 4.0 |
| | Conservative | S. Costain | 499 | 11.4% | 27.4 |
| Majority | 462 | 10.56% | 6.56 |
| Registered electors | 10,694 | | |
| Turnout | 4,374 | 40.9% | 3.4 |
| | Labour gain from Conservative | Swing | 50.4 | |
[3] [4]
Liverpool No.12 (County)
Liverpool No.12 (County) | Party | Candidate | Votes | % | ±% |
| | Labour | Sylvia Renilson | 2,230 | 48.7% | 20.1 |
| | Liberal | R. I. Jobling | 1,672 | 36.5% | 4.6 |
| | Conservative | W. Thomas | 668 | 14.6% | 24.9 |
| Majority | 558 | 12.19% | 5.09 |
| Registered electors | 12,015 | | |
| Turnout | 4,578 | 38.1% | |
| | Labour gain from Conservative | Swing | 45.0 | |
[3] [4]
Liverpool No.13 (Croxteth)
Liverpool No.13 (Croxteth) | Party | Candidate | Votes | % | ±% |
| | Conservative | E.H. Fitzpatrick | 2,119 | 44.5% | 9.8 |
| | Labour | F. Burke | 1,577 | 33.1% | 20 |
| | Liberal | T. R.Jones | 1,056 | 22.2% | 10.4 |
| Majority | 542 | 11.38 | 9.8 |
| Registered electors | 13,370 | | |
| Turnout | 4,764 | 35.6% | 12.6 |
| | Conservative hold | Swing | 9.8 | |
[3] [4]
Liverpool No.14 (Dingle)
Liverpool No.14 (Dingle) | Party | Candidate | Votes | % | ±% |
| | Labour | M. Evans * | 1,662 | 63.9% | 9.8 |
| | Liberal | J. C. Cawley | 687 | 27.1 | 18.1 |
| | Conservative | J. A. Watson | 168 | 6.6 | 26.6 |
| | Communist | J. Greig | 46 | 2 | 2.2 |
| Majority | 935 | 36.85 | 17.25 |
| Registered electors | 7,269 | | |
| Turnout | 2,537 | 34.9% | 10 |
| | Labour hold | Swing | 9.8 | |
[3] [4]
Liverpool No.15 (Dovecot)
Liverpool No.15 (Dovecot) | Party | Candidate | Votes | % | ±% |
| | Labour | J. V. Walsh | 3,167 | 53.2% | 11.9 |
| | Liberal | G.B.Smith | 1,850 | 31.1% | 18.4 |
| | Conservative | J. L. Walsh | 896 | 15.1% | 27.9 |
| Majority | 1,317 | 22.13% | 17.43 |
| Registered electors | 16,258 | | |
| Turnout | 5,950 | 36.6% | 7.7 |
| | Labour gain from Conservative | Swing | 27.0 | |
[3] [4]
Liverpool No.16 (Fairfield)
Liverpool No.16 (Fairfield) | Party | Candidate | Votes | % | ±% |
| | Liberal | Frank Doran | 1,805 | 55.7% | 21.5% |
| | Labour | S. J. Gorman | 1,056 | 32.6% | 6.5 |
| | Conservative | Mary Davis | 361 | 11.4% | 26.6 |
| Majority | 749 | 23.12% | 19.12 |
| Registered electors | 9,771 | | |
| Turnout | 3,240 | 33.2% | 1.1 |
| | Liberal gain from Conservative | Swing | 48.1 | |
[3] [4]
Liverpool No.17 (Fazakerley)
Liverpool No.17 (Fazakerley) | Party | Candidate | Votes | % | ±% |
| | Labour | W. F. Roe | 2,347 | 58.1% | 28.8 |
| | Conservative | A. Brown | 943 | 23.3% | 20.2 |
| | Liberal | Patricia Fairhurst | 740 | 18.3% | 9.0 |
| Majority | 1,404 | 34.76 | 20.56 |
| Registered electors | 11,313 | | |
| Turnout | 4,039 | 35.7% | 3.2 |
| | Labour gain from Conservative | Swing | 49.0 | |
[3] [4]
Liverpool No.18 (Gillmoss)
Liverpool No.18 (Gillmoss) - 2 seats | Party | Candidate | Votes | % | ±% |
| | Labour | A. Jennings | 4,409 | 83.4% | 23.7 |
| | Labour | T. McManus | 4,212 | 79.7% | |
| | Liberal | J. Farley | 451 | 8.5% | |
| | Conservative | A. Gore | 447 | 8.5% | 31.8 |
| | Liberal | J. G. Morgan | 429 | 8.1% | |
| | Conservative | D.G.Dougherty | 428 | 8.1% | |
| Majority | 3,958 | 74.85% | 25.15 |
| Registered electors | 18,439 | | |
| Turnout | 5,288 | 28.7 | 3.3 |
| | Labour hold | Swing | 23.7 | |
| | Labour hold | Swing | | |
[3] [4]
Liverpool No.19 (Granby & Princes Park)
Liverpool No.19 (Granby & Princes Park) | Party | Candidate | Votes | % | ±% |
| | Labour | Margaret Simey | 1,940 | 58.0% | 10.2 |
| | Liberal | A.Damsell | 1,041 | 31.1% | 19.6 |
| | Conservative | A. Palin | 277 | 8.3% | 27.3 |
| | Communist | S. P. Munby | 66 | 2% | 3.3 |
| Majority | 899 | 26.88% | 16.68 |
| Registered electors | 11,110 | | |
| Turnout | 3,344 | 30.1% | 6.7 |
| | Labour hold | Swing | 10.2 | |
[3] [4]
Liverpool No.20 (Kensington)
Liverpool No.20 (Kensington) | Party | Candidate | Votes | % | ±% |
| | Liberal | A.H.Thomas | 1,236 | 51.7% | 6.5 |
| | Labour | L.Reynolds | 997 | 41.7% | 19.4 |
| | Conservative | D.Ellis | 149 | 6.2% | 13.5 |
| Majority | 239 | 10.0% | 26 |
| Registered electors | 6,551 | | |
| Turnout | 2,391 | 36.5% | 1.1 |
| Rejected ballots | 9 | 0.38% | |
| | Liberal hold | Swing | 6.5 | |
[3] [4]
Liverpool No.21 (Low Hill & Smithdown)
Liverpool No.21 (Low Hill & Smithdown) | Party | Candidate | Votes | % | ±% |
| | Liberal | N. Caple | 1,577 | 49.0% | 4.9 |
| | Labour | A. Gamble | 1,523 | 47.4% | 15.3 |
| | Conservative | A. R. Hopkinsons | 108 | 3.4% | 9.1 |
| Majority | 54 | 1.69% | 10.8 |
| Registered electors | 8,462 | | |
| Turnout | 3,216 | 38.0% | 4.9 |
| Rejected ballots | 8 | 0.25% | |
| | Liberal hold | Swing | 4.9 | |
[3] [4]
Liverpool No.22 (Melrose & Westminster)
Liverpool No.22 (Melrose & Westminster) | Party | Candidate | Votes | % | ±% |
| | Labour | B. Shaw * | 2,045 | 59.4% | 0% |
| | Liberal | K. A. Sewill | 1,237 | 35.9% | 25.0 |
| | Conservative | S. Fitzsimmons | 154 | 4.5% | 27.2 |
| Majority | 808 | 23.47% | 4.23 |
| Registered electors | 8,140 | | |
| Turnout | 3,443 | 42.3% | 16.5 |
| | Labour hold | Swing | 0.0% | |
[3] [4]
Liverpool No.23 (Old Swan)
Liverpool No.23 (Old Swan) | Party | Candidate | Votes | % | ±% |
| | Labour | Jane A. Hollinshead | 2,572 | 52.6% | 11.2 |
| | Liberal | D. M. Galbraith | 1,194 | 24.4% | 11.7 |
| | Conservative | W. H. Connolly | 973 | 19.9% | 21.5 |
| | Communist | H. Mohin | 65 | 1.3% | 1.2 |
| | Independent Liberal | K. McCullough | 61 | 1.25% | 0.45 |
| Majority | 1,378 | 28.2% | 22.9% |
| Registered electors | 12,095 | | |
| Turnout | 4,886 | 40.4% | 2.1 |
| Rejected ballots | 21 | 0.43% | |
| | Labour hold | Swing | 11.2 | |
[3] [4]
Liverpool No.24 (Picton)
Liverpool No.24 (Picton) | Party | Candidate | Votes | % | ±% |
| | Liberal | P. D. Mahon * | 2,668 | 59.5% | 16.5 |
| | Labour | R. J. Clarke | 1,336 | 29.8% | 2.8 |
| | Conservative | I. G. McKellar | 395 | 8.8% | 19.2 |
| | Communist | J. G. Volleamere | 68 | 1.5% | 0.5 |
| Majority | 1,332 | 29.71% | |
| Registered electors | 10,856 | | |
| Turnout | 4,484 | 41.3% | 4.0 |
| Rejected ballots | 17 | 0.38% | |
| | Liberal hold | Swing | 16.5 | |
[3] [4]
Liverpool No.25 (Pirrie)
Liverpool No.25 (Pirrie) | Party | Candidate | Votes | % | ±% |
| | Labour | R. N. Wareing | 4,280 | 75.8% | 30.0 |
| | Conservative | J. M. Wright | 788 | 14.0% | 33.0% |
| | Liberal | T. G. Ellis | 567 | 10.0% | 2% |
| Majority | 3,492 | 61.85% | |
| Registered electors | 15,727 | | |
| Turnout | 5,646 | 35.9% | 3.9 |
| Rejected ballots | 11 | 0.19% | |
| | Labour gain from Conservative | Swing | 63% | |
[3] [4]
Liverpool No.26 (St. Marys)
Liverpool No.26 (St. Marys) | Party | Candidate | Votes | % | ±% |
| | Labour | H. Keidan | 1,721 | 49.0% | 10.0% |
| | Liberal | Peter Milea | 1,070 | 30.4% | 18.4 |
| | Conservative | D. R. Hawes | 649 | 18.5% | 27.5 |
| | Communist | R. Ross | 57 | 1.6% | 1.4 |
| Majority | 651 | 18.53% | |
| Registered electors | 8,741 | | |
| Turnout | 3,514 | 40.1% | 10.1 |
| Rejected ballots | 17 | 0.48% | |
| | Labour gain from Conservative Party(UK) | Swing | 37.5 | |
[3] [4]
Liverpool No.27 (St. Michaels)
Liverpool No.27 (St. Michaels) | Party | Candidate | Votes | % | ±% |
| | Labour | G. G. Pratt | 1,141 | 36.1% | 18.1 |
| | Liberal | G. Abrams | 1,140 | 36.1% | 0.9 |
| | Conservative | R. S. Jones * | 863 | 27.3% | 18.7 |
| Majority | 1 | 0.03% | |
| Registered electors | 9,576 | | |
| Turnout | 3,160 | 33.0% | 1.0 |
| Rejected ballots | 16 | 0.51% | |
| | Labour gain from Conservative | Swing | 19 | |
[3] [4]
Liverpool No.28 (Sandhills & Vauxhall)
Liverpool No.28 (Sandhills & Vauxhall) | Party | Candidate | Votes | % | ±% |
| | Labour | J. Hughes | 2,569 | 79.4% | 0.6 |
| | Liberal | S.Radford | 192 | 5.9% | 1.1 |
| | Conservative | Hazel J. Clarke | 59 | 1.8% | 11.1 |
| Majority | 2,377 | 73.48% | 6.48 |
| Registered electors | 8,381 | | |
| Turnout | 3,235 | 38.6% | 21.6% |
| Rejected ballots | | | |
| | Labour hold | Swing | 0.6 | |
[3] [4]
Liverpool No.29 (Speke)
Liverpool No.29 (Speke) | Party | Candidate | Votes | % | ±% |
| | Labour | B. Simpson | 2,934 | 69.9% | 13.9 |
| | Liberal | J. D. Ball | 832 | 19.8% | 12.8 |
| | Conservative | A. Nugent | 430 | 10.2% | 26.8 |
| Majority | 2,102 | 50.08% | 31.08% |
| Registered electors | 13,281 | | |
| Turnout | 4,197 | 31.6% | 10.6 |
| Rejected ballots | 1 | 0.02% | |
| | Labour hold | Swing | 13.9 | |
[3] [4]
Liverpool No.30 (Tuebrook)
Liverpool No.30 (Tuebrook) | Party | Candidate | Votes | % | ±% |
| | Liberal | B. Gore | 1,890 | 44.3% | 14.3 |
| | Labour | T. McDonald | 1,690 | 39.6% | 16.6 |
| | Conservative | J. Irving | 676 | 15.8% | 30.2 |
| Majority | 200 | 4.68% | |
| Registered electors | 10,570 | | |
| Turnout | 4,270 | 40.4% | 5.4 |
| | Liberal gain from Conservative | Swing | 44.5 | |
[3] [4]
Liverpool No.31 (Warbreck)
Liverpool No.31 (Warbreck) | Party | Candidate | Votes | % | ±% |
| | Labour | R. Riley | 1,455 | 41.6% | 20.6 |
| | Conservative | R. B. Flude * | 1,140 | 32.6% | 16.4 |
| | Liberal | H. G. Rogers | 883 | 25.3% | 3.7 |
| Majority | 315 | 9.01% | |
| Registered electors | 10,955 | | |
| Turnout | 3,495 | 31.9% | 3.1 |
| Rejected ballots | 17 | 0.49% | |
| | Labour gain from Conservative party (UK) | Swing | 37.0 | |
[3] [4]
Liverpool No.32 (Woolton East)
Liverpool No.32 (Woolton East) | Party | Candidate | Votes | % | ±% |
| | Labour | L. Evans * | 3,152 | 77.3% | 28.3 |
| | Liberal | Jean E.Nester | 483 | 11.8% | 4.8 |
| | Conservative | Pamela Stephen | 429 | 10.5% | 27.5 |
| Majority | 2,723 | 66.81% | 55.81 |
| Registered electors | 11,848 | | |
| Turnout | 4,076 | 34.4% | 6.4 |
| Rejected ballots | 12 | 0.29% | |
| | Labour hold | Swing | 28.3 | |
[3] [4]
Liverpool No.33 (Woolton West)
Liverpool No.33 (Woolton West) - 2 seats | Party | Candidate | Votes | % | ±% |
| | Conservative | L. B. Williams * | 3,681 | 54.6% | 21.4 |
| | Conservative | T. L. Hobday * | 3,679 | 54.6% | 21.4 |
| | Labour | D. A. Bradbury | 1,723 | 25.6% | 13.6 |
| | Labour | P. R. Martin | 1,671 | 24.8% | 13.8 |
| | Liberal | C. Mayes | 1,335 | 19.8% | 8.8 |
| | Liberal | R. J. Ormsby | 1,286 | 19.1% | 8.1 |
| Majority | 1,958 | 29.05% | |
| Registered electors | 17,859 | | |
| Turnout | 6,739 | 37.7% | 6.3 |
| Rejected ballots | 0 | 0% | |
| | Conservative hold | Swing | 21.4 | |
| | Conservative hold | Swing | 21.4 | |
[3] [4]
Sefton
Bootle No.1
Bootle No.1 (Derby & Stanley) | Party | Candidate | Votes | % | ±% |
| | Labour | A. S. Moore | 2,677 | 68% | 25 |
| | Conservative | F. P. Morris * | 788 | 20% | 28 |
| | Liberal | Mrs. H. Fjortoft | 458 | 12% | 5 |
| Majority | 1,889 | 48.05% | 43.05 |
| Registered electors | 12,640 | | |
| Turnout | 3,931 | 31% | |
| Rejected ballots | 8 | 0.2% | |
| | Conservative gain from Labour | Swing | 53 | |
[4]
Bootle No.2 (Linacre & Mersey)
Bootle No.2 (Linacre & Mersey) | Party | Candidate | Votes | % | ±% |
| | Labour | W. A. Wiseman * | 2,142 | 77% | 18 |
| | Liberal | R. E. Williams | 337 | 12% | N/A |
| | Conservative | H. E. Dunbar | 285 | 10% | 2 |
| Majority | 1,805 | 64.88% | |
| Registered electors | 9,432 | | |
| Turnout | 2,782 | 29% | 12 |
| Rejected ballots | 18 | 0.65% | |
| | Labour hold | Swing | 18 | |
[4]
Bootle No.3 (Netherton, Orrell & Sefton)
Bootle No.3 (Netherton, Orrell & Sefton) - 2 seats | Party | Candidate | Votes | % | ±% |
| | Labour | B. Hillen * | 5,255 | 68% | 8 |
| | Labour | T. J. McNicholas | 5,109 | 66% | 18 |
| | Liberal | A. J. F. Harris | 1,336 | 17% | |
| | Liberal | J. Butterfield | 1,291 | 17% | |
| | Conservative | G. Halliwell | 1,117 | 14% | 18 |
| | Conservative | J. F. Burrows | 1,050 | 14% | 28 |
| Majority | 4,138 | 53.68 | |
| Registered electors | 24,130 | | |
| Turnout | 7,704 | 32% | 5 |
| Rejected ballots | | | |
| | Labour hold | Swing | 18 | |
| | Labour hold | Swing | 17 | |
[4]
Crosby No.1 (Central, College & St. John's)
Crosby No.1 (Central, College & St. John's) | Party | Candidate | Votes | % | ±% |
| | Conservative | N. C. Goldrein * | 1,931 | 41% | 28 |
| | Liberal | K. Sartain | 1,507 | 32% | 15 |
| | Labour | J. C. Hulligan | 1,293 | 27% | 10 |
| Majority | 424 | 8.96% | 43.04 |
| Registered electors | 11,943 | | |
| Turnout | 4,731 | 40% | 4 |
| Rejected ballots | | | |
| | Conservative hold | Swing | 28 | |
[4]
Crosby No.2 (Christ Church, St. Mary's & St. Thomas)
Crosby No.2 (Christ Church, St. Mary's & St. Thomas) | Party | Candidate | Votes | % | ±% |
| | Labour | R. D. Waring | 2,325 | 57% | 19 |
| | Conservative | R. O. Harvey * | 1,013 | 25% | 31 |
| | Liberal | V. B. Kehoe | 754 | 18% | 12 |
| Majority | 1,312 | 13.91% | |
| Registered electors | 10,278 | | |
| Turnout | 4,111 | 40% | 7 |
| Rejected ballots | 19 | 0.46% | |
| | Labour gain from Conservative party (UK) | Swing | 50 | |
[4]
Crosby No.3
Crosby No.3 | Party | Candidate | Votes | % | ±% |
| | Conservative | W. R. Bennett * | 2,074 | 54% | 18 |
| | Labour | E. A. Murphy | 1,771 | 46% | 26 |
| Majority | 303 | 7.85% | |
| Registered electors | 10,323 | | |
| Turnout | 3,861 | 37% | |
| Rejected ballots | 16 | 0.41% | |
| | Conservative hold | Swing | 18 | |
[4]
Crosby No.4
Crosby No.4 | Party | Candidate | Votes | % | ±% |
| | Conservative | F. L. Pritchard * | 2,581 | 69% | 13 |
| | Labour | G. Stringer | 654 | 17% | 10 |
| | Liberal | C. E. Bolger | 521 | 14% | 3 |
| Majority | 1,927 | 51.20% | |
| Registered electors | 9,203 | | |
| Turnout | 3,764 | 41% | 5 |
| Rejected ballots | 8 | 0.21% | |
| | Conservative hold | Swing | 13 | |
[4]
Formby
Formby | Party | Candidate | Votes | % | ±% |
| | Conservative | J. R. Murray-Bligh | 3,629 | 49% | 32% |
| | Liberal | Margaret Metcalfe | 2,142 | 29% | 10 |
| | Labour | J. L. Linden | 1,206 | 16% | |
| | Ecology Party | R. W. Small | 474 | 6. 4% | |
| Majority | 1,487 | 19.94% | |
| Registered electors | 18,599 | | |
| Turnout | 7,458 | 40% | 3 |
| Rejected ballots | 7 | 0.09% | |
| | Conservative hold | Swing | 32 | |
[4]
Litherland
Litherland | Party | Candidate | Votes | % | ±% |
| | Labour | E. Lawrenson | 4,133 | 73% | 29 |
| | Conservative | Mrs. G. Buckles | 1,472 | 26% | 22 |
| Majority | 2,661 | 47.29% | |
| Registered electors | 16,077 | | |
| Turnout | 5,627 | 35% | 1 |
| Rejected ballots | 22 | 0.39% | |
| | Labour gain from Conservative | Swing | 51 | |
[4]
Southport No.1 (Ainsdale, Birkdale & South)
Southport No.1 (Ainsdale, Birkdale & South) | Party | Candidate | Votes | % | ±% |
| | Conservative | J. Hartley * | 2,606 | 56% | 31 |
| | Liberal | R. W. Rothwell | 1,266 | 27.2% | 1.2 |
| | Labour | J. F. Caven | 777 | 17% | 7 |
| Majority | 1,340 | 28.79% | 32.21 |
| Registered electors | 14,192 | | |
| Turnout | 4,655 | 33% | |
| Rejected ballots | 6 | 0.13% | |
| | Conservative hold | Swing | 31 | |
[4]
Southport No.2
Southport No.2 | Party | Candidate | Votes | % | ±% |
| | Liberal | R. Rimmer | 1,759 | 40% | 14 |
| | Conservative | B. Lamont | 1,548 | 35% | 24 |
| | Labour | S. Forkins | 1,101 | 25% | 10 |
| Majority | 211 | 4.79% | |
| Registered electors | 12,174 | | |
| Turnout | 4,408 | 36% | 3 |
| Rejected ballots | | | |
| | Liberal gain from Conservative | Swing | 38 | |
[4]
Southport No.3 (Birkdale West-Central-West)
Southport No.3 (Birkdale West-Central-West) | Party | Candidate | Votes | % | ±% |
| | Liberal | S. Shaw | 1,681 | 50.0% | 28 |
| | Conservative | J. Morland | 1,675 | 49.8% | 28.2 |
| Majority | 6 | 0.18% | |
| Registered electors | 9,120 | | |
| Turnout | 3,365 | 37% | 3 |
| Rejected ballots | 9 | 0.27% | |
| | Liberal hold | Swing | 56.2 | |
[4]
Southport No.4 (Craven-Sussex-Talbot)
Southport No.4 (Craven-Sussex-Talbot) | Party | Candidate | Votes | % | ±% |
| | Liberal | Ronald Fearn * | 3,213 | 76% | 26 |
| | Conservative | J. Heaton | 997 | 24% | 16 |
| Majority | 2,216 | 52.4% | |
| Registered electors | 11,188 | | |
| Turnout | 4,229 | 38% | 4 |
| Rejected ballots | 19 | 0.45% | |
| | Liberal hold | Swing | 26 | |
[4]
Southport No.5 (Hesketh & Scarisbrick)
Southport No.5 (Hesketh & Scarisbrick) | Party | Candidate | Votes | % | ±% |
| | Liberal | D. Griffiths | 2,611 | 48% | 13 |
| | Conservative | Mrs. J. Leech * | 2,134 | 40% | 16 |
| | Labour | A. Bell | 643 | 12% | 3 |
| Majority | 477 | 8.85% | |
| Registered electors | 11,516 | | |
| Turnout | 5,389 | 47% | 3 |
| Rejected ballots | 1 | 0.02% | |
| | Liberal gain from Conservative | Swing | 29 | |
[4]
Southport No.6 (Marine and Park)
Southport No.6 (Marine and Park) | Party | Candidate | Votes | % | ±% |
| | Conservative | J. Robinson | 1,831 | 47% | 20 |
| | Liberal | N. Jones | 1,673 | 42% | 9 |
| | Labour | R. Burnett | 428 | 11% | |
| Majority | 158 | 4.01% | |
| Registered electors | 11,378 | | |
| Turnout | 3,937 | 35% | 4 |
| Rejected ballots | 5 | 0.13% | |
| | Conservative hold | Swing | 20 | |
[4]
West Lancashire No.1 (Aintree)
West Lancashire No.1 (Aintree) | Party | Candidate | Votes | % | ±% |
| | Conservative | A. I. Birch * | 2,251 | 64% | 19 |
| | Labour | C. Toner | 1,259 | 36% | 19 |
| Majority | 992 | 28.09% | |
| Registered electors | 9,674 | | |
| Turnout | 3,531 | 36% | 1 |
| Rejected ballots | 21 | 0.59& | |
| | Conservative hold | Swing | 19 | |
[4]
West Lancashire No.2
West Lancashire No.2 | Party | Candidate | Votes | % | ±% |
| | Conservative | C. Currall * | 2,069 | 44% | 32 |
| | Labour | E. Kay | 1,533 | 33% | 10 |
| | Resident | C. Jones | 1,100 | 23.4% | |
| Majority | 536 | 11.39% | 42.21 |
| Registered electors | 14,482 | | |
| Turnout | 4,707 | 33% | 2 |
| Rejected ballots | 5 | 0.11% | |
| | Conservative hold | Swing | 32 | |
[4]
West Lancashire No.3
Sefton West Lancashire No.3 | Party | Candidate | Votes | % | ±% |
| | Conservative | N. Bernard | 1,109 | 31% | N/A |
| | Liberal | J. Parkin | 932 | 26% | N/A |
| | Labour | S. Peacock | 873 | 25% | N/A |
| | Resident | P. Matthews | 628 | 17.7% | N/A |
| Majority | 177 | 4.98% | N/A |
| Registered electors | 10,205 | | |
| Turnout | 3,551 | 35% | N/A |
| Rejected ballots | 9 | 0.25% | N/A |
| | Conservative hold | Swing | N/A | |
[4]
St. Helens
Haydock
Haydock | Party | Candidate | Votes | % | ±% |
| | Labour | D. Craig | 3,759 | 76% | 31 |
| | Conservative | P. Anderton * | 1,191 | 24% | 31 |
| Majority | 2,568 | 51.81% | |
| Registered electors | 12,120 | | |
| Turnout | 4,957 | 41% | 8 |
| Rejected ballots | 7 | 0.14% | |
| | Labour gain from Conservative | Swing | 55 | |
[4]
Newton Le Willows
Newton Le Willows | Party | Candidate | Votes | % | ±% |
| | Labour | J. Duncan | 3,521 | 47% | 2 |
| | Liberal | E. Sherlock | 3,161 | 42% | 28 |
| | Conservative | M. Finlayson | 835 | 11% | 30 |
| Majority | 360 | 4.81% | |
| Registered electors | 14,949 | | |
| Turnout | 7,517 | 50% | 9 |
| Rejected ballots | | | |
| | Labour hold | Swing | 2 | |
[4]
Rainford
Rainford | Party | Candidate | Votes | % | ±% |
| | Conservative | Mrs. A. Berry * | 2,856 | 42% | 36 |
| | Labour | R. Ledwith | 2,843 | 42% | 20 |
| | Liberal | I. Grieg | 1,100 | 16% | N/A |
| Majority | 13 | 0.19% | |
| Registered electors | 15,964 | | |
| Turnout | 6,817 | 43% | 5 |
| Rejected ballots | 13 | 0.19% | |
| | Conservative hold | Swing | 36 | |
[4]
St. Helens No.1 (Central and South Eccleston)
St. Helens No.1 (Central and South Eccleston) | Party | Candidate | Votes | % | ±% |
| | Labour | H.Glover | 2,083 | 66% | 27 |
| | Conservative | Mrs. E. Jameson * | 767 | 24% | 30 |
| | Liberal | P. Fitzmaurice | 299 | 9% | 2 |
| Majority | 1,316 | 41.71% | 26.51% |
| Registered electors | 9,334 | | |
| Turnout | 3,155 | 34% | 1 |
| Rejected ballots | 6 | 0.19% | |
| | Labour gain from Conservative | Swing | 57 | |
[4]
St. Helens No.2 (East Sutton)
St. Helens No.2 | Party | Candidate | Votes | % | ±% |
| | Labour | J. Thompson | 2,561 | 72% | 29 |
| | Liberal | W. Iley | 532 | 14% | 4 |
| | Conservative | A. Taylor | 301 | 8% | 39 |
| | Independent | I. Finney | 104 | 5% | N/A |
| Majority | 2,119 | 57.43% | |
| Registered electors | 12,857 | | |
| Turnout | 3,690 | 29% | 9 |
| Rejected ballots | 22 | 0.60% | |
| | Labour gain from Conservative | Swing | 68 | |
[4]
St. Helens No.3 (Hardshaw and West Sutton)
St. Helens No.3 (Hardshaw and West Sutton) | Party | Candidate | Votes | % | ±% |
| | Labour | T. Talbot | 3,631 | 73% | 33 |
| | Liberal | T. Gilligan | 989 | 20% | 1 |
| | Conservative | R. Jones | 345 | 7% | 30 |
| Majority | 2,642 | 52.91% | |
| Registered electors | 16,479 | | |
| Turnout | 4,993 | 30% | |
| Rejected ballots | 28 | 0.56% | |
| | Labour hold | Swing | 33 | |
[4]
St. Helens No.4 (Moss Bank and North Windle)
St. Helens No.4 (Moss Bank and North Windle) | Party | Candidate | Votes | % | ±% |
| | Labour | T. Gadsden | 2,547 | 55% | 22 |
| | Conservative | E. Jameson * | 1,602 | 35% | 28 |
| | Liberal | P. Pennington | 467 | 10% | 6 |
| Majority | 945 | 20.43% | |
| Registered electors | 12,993 | | |
| Turnout | 4,626 | 36% | 4 |
| Rejected ballots | 10 | 0.22% | |
| | Labour gain from Conservative | Swing | 50 | |
[4]
St. Helens No.5 (North Eccleston and South Windle)
St. Helens No.5 (North Eccleston and South Windle) | Party | Candidate | Votes | % | ±% |
| | Labour | J. Duncan | 1,589 | 69% | 33 |
| | Conservative | W. Carter | 717 | 31% | 33 |
| Majority | 877 | 37.77% | |
| Registered electors | 6,694 | | |
| Turnout | 2,309 | 34% | 3 |
| Rejected ballots | 3 | 0.13% | |
| | Labour gain from Conservative | Swing | | |
[4]
St. Helens No.6 (Parr)
St. Helens No.6 (Parr) | Party | Candidate | Votes | % | ±% |
| | Labour | G. Leyland | 2,672 | 75% | 20% |
| | Conservative | M.Powell | 500 | 14% | 25 |
| | Liberal | P. Dennington | 396 | 11% | 5 |
| Majority | 2,172 | 60.87% | 45.17 |
| Registered electors | 16,507 | | |
| Turnout | 3,568 | 22% | 3 |
| Rejected ballots | | | |
| | Labour hold | Swing | 20 | |
[4]
Whiston No.2 (Eccleston and Windle)
Whiston No.2 (Eccleston and Windle) | Party | Candidate | Votes | % | ±% |
| | Conservative | G. Brownlow | 2,530 | 70% | 18 |
| | Labour | K. Bamforth | 1,052 | 29% | 17 |
| Majority | 1,478 | 41.04% | 34.96 |
| Registered electors | 10,260 | | |
| Turnout | 3,601 | 35% | 13 |
| Rejected ballots | 19 | 0.53% | |
| | Conservative hold | Swing | 18 | |
[4]
Whiston No. 5 (Rainhill and Bold)
Whiston No. 5 (Rainhill and Bold) | Party | Candidate | Votes | % | ±% |
| | Labour | B. McCormick | 1,843 | 41% | 9% |
| | Conservative | Mrs. Nellie Holley | 1,528 | 34% | 34 |
| | Liberal | P. Thomas | 1,117 | 25% | N/A |
| Majority | 315 | 7% | |
| Registered electors | 11,255 | | |
| Turnout | 4,502 | 40% | 14 |
| Rejected ballots | 14 | 0.31% | |
| | Labour gain from Conservative | Swing | 43 | |
[4]
Wirral
Bebington No.1 1 (Higher Bebington and Woodhey)
Bebington No.1 (Higher Bebington and Woodhey) | Party | Candidate | Votes | % | ±% |
| | Conservative | I. Richmond | 2,466 | 53% | 27 |
| | Labour | P. Holt | 1,380 | 30% | N/A |
| | Liberal | P. Golby | 803 | 17% | 3 |
| Majority | 1,086 | 23.28% | |
| Registered electors | 9,942 | | |
| Turnout | 4,663 | 47% | 1 |
| Rejected ballots | 14 | 0.30% | |
| | Conservative hold | Swing | 27 | |
[4]
Bebington No.2 (Park, New Ferry, North Bromborough)
Bebington No.2 (Park, New Ferry, North Bromborough) | Party | Candidate | Votes | % | ±% |
| | Labour | A. Rose | 2,512 | 58% | 17 |
| | Conservative | E. A. Davies | 1,320 | 28% | 23 |
| | Liberal | D. Cottrell | 623 | 14% | 6 |
| Majority | 1,302 | 29.96% | |
| Registered electors | 9,572 | | |
| Turnout | 4,346 | 45% | |
| Rejected ballots | 1 | 0.02% | |
| | Labour gain from Conservative | Swing | 40 | |
[4]
Wirral Bebington No.3 (South Bromborough and Eastham)
Wirral Bebington No.3 (South Bromborough and Eastham) | Party | Candidate | Votes | % | ±% |
| | Liberal | P. N. Gilchrist * | 3,714 | 51% | 6 |
| | Labour | E. Williams | 2,170 | 30% | 10 |
| | Conservative | M. Evans | 1,423 | 19% | 17 |
| Majority | 1,544 | 21.09% | 12.21 |
| Registered electors | 13,866 | | |
| Turnout | 7,321 | 53% | 4 |
| Rejected ballots | 14 | 0.19% | |
| | Conservative hold | Swing | | |
[4]
Bebington No. 4 (Lower Bebington & Poulton)
Bebington No. 4 (Lower Bebington & Poulton) | Party | Candidate | Votes | % | ±% |
| | Conservative | F. J. K. Williams * | 3,479 | 54% | 24 |
| | Labour | J. Durrant | 1,666 | 26% | N/A |
| | Liberal | M. Cody | 1,329 | 20% | 2 |
| Majority | 1,813 | 27.95% | 27.25 |
| Registered electors | 14,511 | | |
| Turnout | 6,486 | 45% | 4 |
| Rejected ballots | 12 | 0.19% | |
| | Conservative hold | Swing | 24 | |
[4]
Birkenhead No.1 (Argyle-Clifton-Holt)
Birkenhead No.1 (Argyle-Clifton-Holt) | Party | Candidate | Votes | % | ±% |
| | Labour | J. Stuart-Cole | 1,831 | 72% | 22 |
| | Liberal | E.Rise | 404 | 16% | |
| | Conservative | F. Dawson | 295 | 12% | 16 |
| Majority | 1,427 | 56.34% | 35.34 |
| Registered electors | 7,016 | | |
| Turnout | 2,533 | 36% | 7% |
| Rejected ballots | 3 | 0.12% | |
| | Labour hold | Swing | 22 | |
[4]
Birkenhead No.2 (Bebington and Mersey)
Birkenhead No.2 (Bebington and Mersey) | Party | Candidate | Votes | % | ±% |
| | Labour | P. Liddell | 1,944 | 68% | 24 |
| | Conservative | H. Welsh * | 590 | 21% | 28 |
| | Liberal | A. Brighouse | 299 | 11% | 4 |
| Majority | 1,354 | 47.71% | |
| Registered electors | 8,220 | | |
| Turnout | 3,535 | 43% | 10 |
| Rejected ballots | 11 | 0.31% | |
| | Labour gain from Conservative | Swing | 52 | |
[4]
Birkenhead No. 3 (Cathcart-Claughton-Cleveland)
Birkenhead No. 3 (Cathcart-Claughton-Cleveland) | Party | Candidate | Votes | % | ±% |
| | Liberal | D. Boxer | 1,535 | 43% | 12 |
| | Labour | N. Holbrook | 1,288 | 36% | 33 |
| | Conservative | D. Esseen | 701 | 20% | 22 |
| Majority | 834 | 23.59% | |
| Registered electors | 8,220 | | |
| Turnout | 3,535 | 43% | 10 |
| Rejected ballots | 11 | 0.31% | |
| | Liberal hold | Swing | 12 | |
[4]
Birkenhead No.4 (Devonshire and Egerton)
Birkenhead No.4 (Devonshire and Egerton) | Party | Candidate | Votes | % | ±% |
| | Labour | V. Ruck | 2,347 | 50% | 26 |
| | Conservative | W. R. Baker * | 1,269 | 27% | 17 |
| | Liberal | P. Lloyd | 1,082 | 23% | 9 |
| Majority | 1,078 | 22.95% | |
| Registered electors | 11,742 | | |
| Turnout | 4,698 | 40% | |
| Rejected ballots | | | |
| | Labour gain from Conservative | Swing | | |
[4]
Birkenhead No. 5 (Bidston)
Birkenhead No. 5 (Bidston) | Party | Candidate | Votes | % | ±% |
| | Labour | J. McCabe | 2,034 | 63% | 5 |
| | Liberal | R. Wood | 932 | 29% | 9 |
| | Conservative | R. Owen | 263 | 8% | 14 |
| Majority | 1,771 | 54.73% | 18 |
| Registered electors | 8,450 | | |
| Turnout | 3,236 | 38% | 6 |
| Rejected ballots | 7 | 0.22% | |
| | Labour hold | Swing | 5 | |
[4]
Birkenhead No.6 (Oxton)
Birkenhead No.6 (Oxton) | Party | Candidate | Votes | % | ±% |
| | Liberal | A. Brame | 2,542 | 46% | 7 |
| | Conservative | F. J. Morton * | 1,553 | 28% | 17 |
| | Labour | A. Chape | 1,258 | 23% | 11 |
| | The Ecology Party | J. Bell | 111 | 2% | |
| Majority | 989 | 18.07% | 11.6 |
| Registered electors | 12,820 | | |
| Turnout | 5,474 | 43% | 5 |
| Rejected ballots | 10 | 0.18% | |
| | Liberal gain from Conservative | Swing | | |
[4]
Birkenhead No. 7 (Prenton)
Birkenhead No. 7 (Prenton) | Party | Candidate | Votes | % | ±% |
| | Labour | W. Gamet | 3,556 | 55% | 29 |
| | Conservative | A. E. Wise * | 2,827 | 44% | 21 |
| Majority | 729 | 11.37% | 27.63 |
| Registered electors | 15,087 | | |
| Turnout | 6,412 | 43% | 8 |
| Rejected ballots | 29 | 0.45% | |
| | Labour gain from Conservative | Swing | | |
[4]
Birkenhead No.8 (Upton)
Birkenhead No.8 (Upton) | Party | Candidate | Votes | % | ±% |
| | Labour | D. Kean | 4,565 | 56% | 24 |
| | Conservative | I. Allison | 1,975 | 24% | 37 |
| | Liberal | E. Copestake | 1,558 | 19% | 12 |
| Majority | 2,590 | 31.97% | 2.97 |
| Registered electors | 21,431 | | |
| Turnout | 8,101 | 38% | 5 |
| Rejected ballots | 3 | 0.04% | |
| | Labour gain from Conservative | Swing | | |
[4]
Hoylake No.1 (Royden)
Hoylake No.1 (Royden) | Party | Candidate | Votes | % | ±% |
| | Conservative | R. Stretch | 3,205 | 62% | 20 |
| | Liberal | N. Blackwood | 1,127 | 22% | 17 |
| | Labour | I. Travis | 793 | 15% | 6 |
| Majority | 2,078 | 40.5% | 32.1 |
| Registered electors | 14,173 | | |
| Turnout | 5,131 | 36% | 7 |
| Rejected ballots | 6 | 0.12% | |
| | Conservative hold | Swing | 20 | |
[4]
Hoylake No.2 (Hoylake)
Hoylake No.2 (Hoylake) | Party | Candidate | Votes | % | ±% |
| | Conservative | J. W. Last * | 2,754 | 58% | 20 |
| | Liberal | P. Barker | 1,392 | 30% | 15 |
| | Labour | J. Robb | 556 | 12% | 5 |
| Majority | 1,362 | 28.87% | 32.63 |
| Registered electors | 12,127 | | |
| Turnout | 4,717 | 39% | 10 |
| Rejected ballots | 15 | 0.32% | |
| | Conservative hold | Swing | 20 | |
[4]
Wallasey No.1 (Leasowe))
Wallasey No.1 (Leasowe)) | Party | Candidate | Votes | % | ±% |
| | Labour | J. George | 2,611 | 64% | 20 |
| | Conservative | A. Downie | 821 | 20% | 27 |
| | Liberal | B. Thomas | 656 | 16% | 10 |
| Majority | 1,790 | 43.79% | 40.13 |
| Registered electors | 11,915 | | |
| Turnout | 4,088 | 34% | 2 |
| Rejected ballots | | | |
| | Labour party (UK) gain from Conservative | Swing | | |
[4]
Wallasey No.2 (Liscard)
Wallasey No.2 (Liscard) | Party | Candidate | Votes | % | ±% |
| | Labour | D. Mason | 2,154 | 45% | 18 |
| | Conservative | K. Young | 1,713 | 35% | 28 |
| | Liberal | M. Canning | 827 | 17% | 7 |
| | British Democratic Party | R. Eccleston | 132 | 3% | N/A |
| Majority | 441 | 9.12% | 27.33 |
| Registered electors | 12,692 | | |
| Turnout | 4,836 | 38% | 2.16 |
| Rejected ballots | 10 | 0.21% | 0.13 |
| | Labour gain from Conservative | Swing | | |
[4]
Wallasey No.3 (Moreton)
Wallasey No.3 (Moreton) | Party | Candidate | Votes | % | ±% |
| | Labour | R. Patterson | 1,564 | 50% | 21 |
| | Conservative | D. Williams | 1,035 | 33% | 33 |
| | Liberal | J. C. Jenkins | 506 | 16% | 11 |
| Majority | 529 | 17.02% | 19.12 |
| Registered electors | 8,180 | | |
| Turnout | 3,108 | 38% | 4 |
| Rejected ballots | 3 | 0.10% | |
| | Labour gain from Conservative | Swing | | |
[4]
Wallasey No.4 (Wallasey)
Wallasey No.4 (Wallasey) | Party | Candidate | Votes | % | ±% |
| | Conservative | M. F. Emberton * | 3,687 | 61% | 8 |
| | Liberal | I. Horton | 1,299 | 21% | 5 |
| | Labour | V. McGee | 1,085 | 18% | 14 |
| Majority | 2,388 | 39.24% | 4.01 |
| Registered electors | 14,217 | | |
| Turnout | 6,085 | 43% | 10 |
| Rejected ballots | 14 | 0.23% | |
| | Conservative hold | Swing | 8 | |
[4]
Wallasey No.5 (New Brighton)
Wallasey No.5 (New Brighton) | Party | Candidate | Votes | % | ±% |
| | Conservative | K. W. Porter * | 1,883 | 49% | 27 |
| | Labour | J. Fairbrother | 1,118 | 29% | 14 |
| | Liberal | J. Canning | 689 | 18% | 9 |
| | British Democratic Party | R. Lloyd-Parry | 132 | 3% | N/A |
| Majority | 765 | 20% | 41.56 |
| Registered electors | 11.316 | | |
| Turnout | 3,825 | 34% | 3 |
| Rejected ballots | 3 | 0.08% | |
| | Conservative hold | Swing | 27 | |
[4]
Wallasey No.6 (Seacombe)
Wallasey No.6 (Seacombe) | Party | Candidate | Votes | % | ±% |
| | Labour | J. Gershman * | 2,200 | 71% | 25 |
| | Conservative | A. Adams | 590 | 19% | 25 |
| | Liberal | D. Bentley | 300 | 10% | 2 |
| Majority | 1,610 | 52% | 47.98 |
| Registered electors | 10,638 | | |
| Turnout | 3,096 | 29% | 5 |
| Rejected ballots | 6 | 0.19% | |
| | Labour hold | Swing | 25 | |
[4]
Wirral No.1 (Heswall)
Wirral No.1 (Heswall) | Party | Candidate | Votes | % | ±% |
| | Conservative | J. C. Smyth * | 3,696 | 83% | 5 |
| | Labour | R. Harris | 724 | 16% | 7 |
| Majority | 2,972 | 66.92% | 14.82 |
| Registered electors | 11,594 | | |
| Turnout | 4,441 | 38% | 8 |
| Rejected ballots | 21 | 0.47% | |
| | Conservative hold | Swing | 5 | |
[4]
Wirral No.2 (Irby, Pensby & Thurstaston)
Wirral No.2 (Thurstaston)) | Party | Candidate | Votes | % | ±% |
| | Conservative | M. Lavender | 1,928 | 51% | 25 |
| | Liberal | A. Conway | 941 | 25% | 16 |
| | Labour | A. Rea | 886 | 24% | 9 |
| Majority | 1,042 | 27.71% | 33.92 |
| Registered electors | 10,189 | | |
| Turnout | 3,760 | 37% | 9 |
| Rejected ballots | 5 | 0.13% | |
| | Conservative hold | Swing | 25 | |
[3] [4]
Notes
References
- ^ a b c d e f g h "Local Election Summaries 1981". The Elections Centre. Retrieved 2 December 2018.
- ^ Jeffery, David. "Merseyside Local Election Results Project". Dr David Jeffery. Retrieved 6 May 2021.
- ^ a b c d e f g h i j k l m n o p q r s t u v w x y z aa ab ac ad ae af ag ah ai aj ak al am an ao ap aq ar Rallings, Colin; Thrasher, Michael. Local Elections Handbook 1977. The Elections Centre. Retrieved 5 December 2018.
- ^ a b c d e f g h i j k l m n o p q r s t u v w x y z aa ab ac ad ae af ag ah ai aj ak al am an ao ap aq ar as at au av aw ax ay az ba bb bc bd be bf bg bh bi bj bk bl bm bn bo bp bq br bs bt bu bv bw bx by bz ca cb cc cd ce cf cg ch ci cj ck cl cm cn co cp cq "Merseyside Local Election Results Project - Dr. David Jeffery". Retrieved 21 December 2023.

 1.3%)[1]
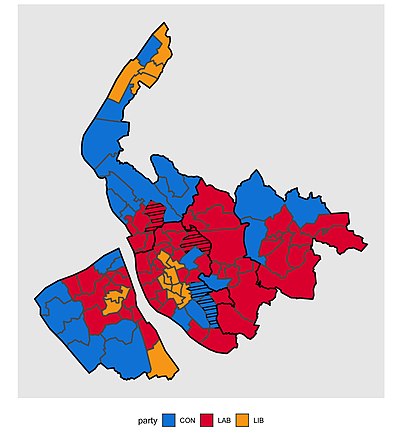

 40
40  0
0 


